Peak · 2020-02-19
Before the break
- Warning
- 1 / 12
- Regime
- 75.4
- Above MA20
- 70.0%
- SPY drawdown
- 0.0%
Historical stress laboratory
A close-by-close reconstruction of participation, regime and sell-off risk through COVID-19 and seven other market declines. This is an event study—not a claim that an external shock could have been forecast in advance.
COVID-19 · Deep dive
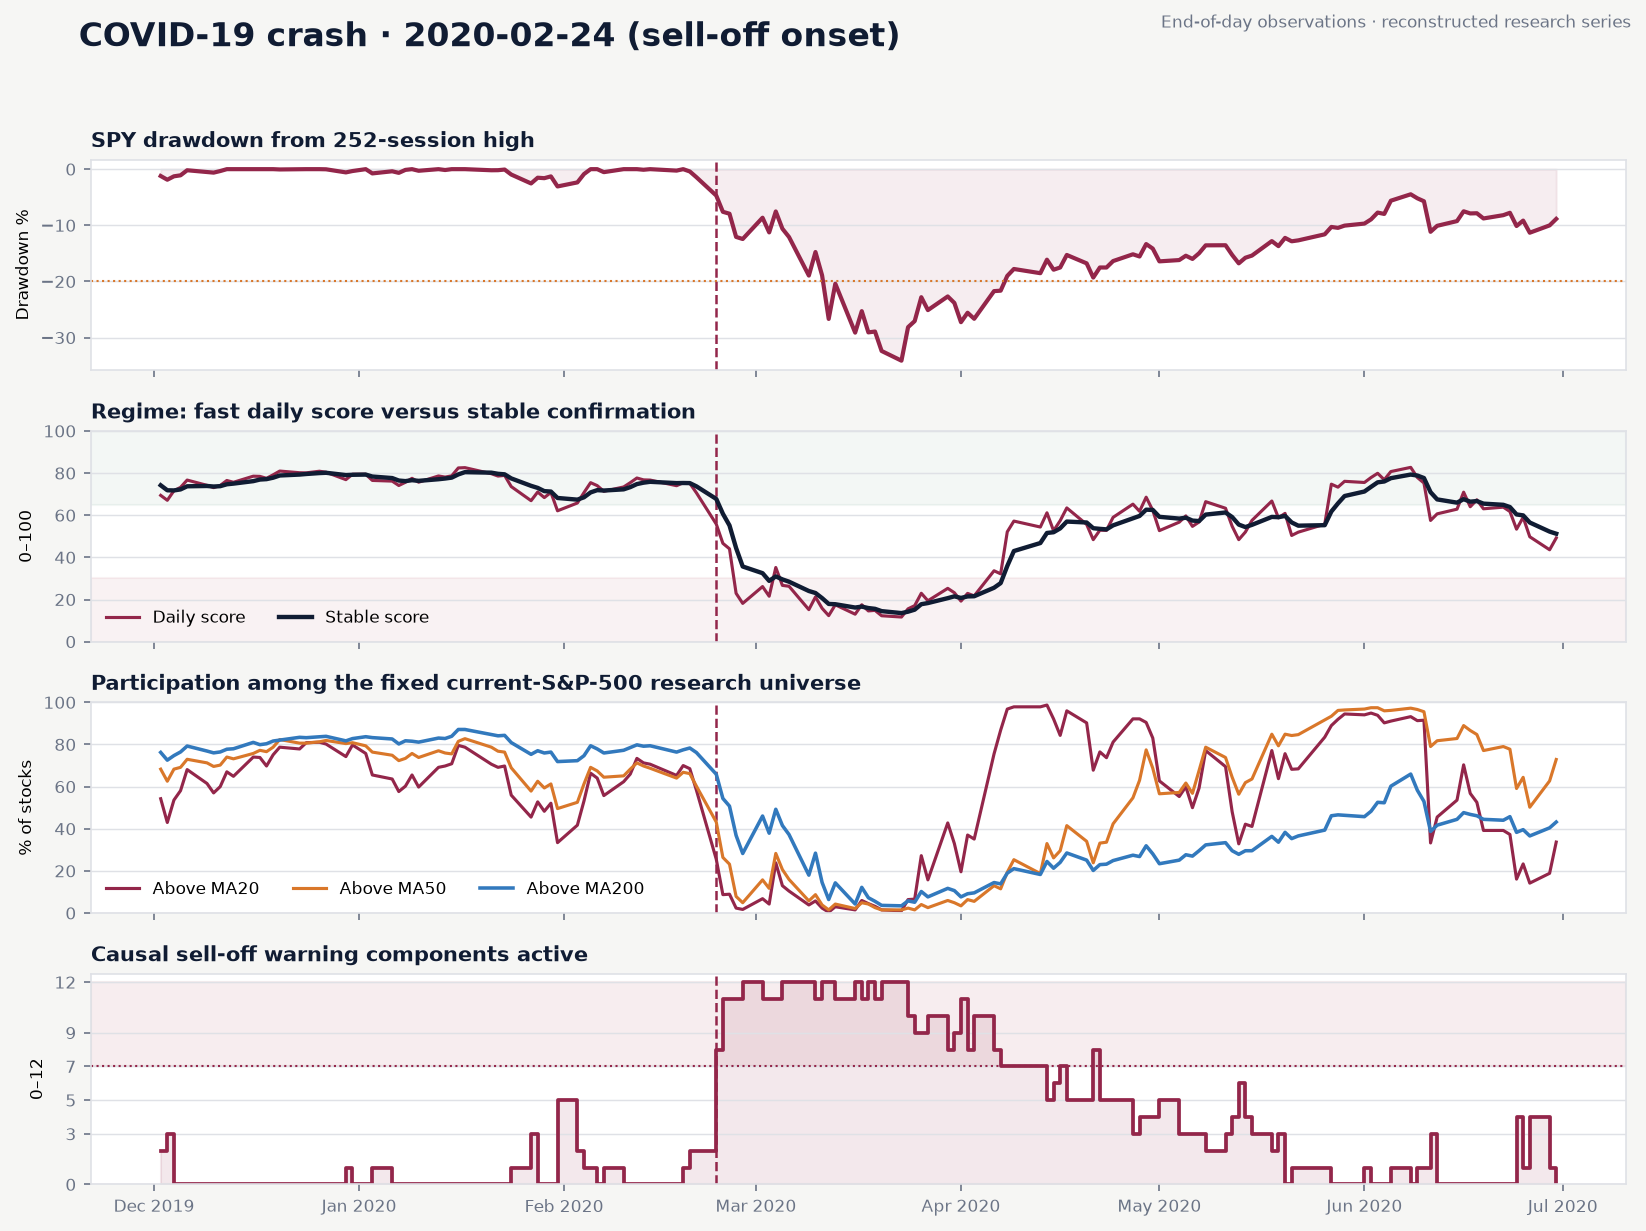
The warning model was quiet at the 19 February peak. It moved to 8 of 12 components after the first broad break on 24 February and reached 12 of 12 during the March liquidation. The stable regime deliberately reacted more slowly than the raw daily score.
Peak · 2020-02-19
Before the break
Onset · 2020-02-24
First broad sell-off
Stress · 2020-03-09
All warning components active
Trough · 2020-03-23
Maximum drawdown in this window
Rebound · 2020-04-06
Fast breadth recovery, stable regime still lagging
Recovery · 2020-06-08
Warning state cleared
Only 1 warning component was active at the market peak. The model recognised the broad damage at the first major sell-off close; that is risk detection, not advance knowledge of an external shock.
MA20 breadth fell from 70.0% to 25.5% by the onset while MA200 breadth remained 65.9%. That split exposed acute short-term damage before long-term structure fully collapsed.
On 6 April, MA20 breadth had rebounded to 75.5%, but the stable regime remained Risk-Off. The lag reduced one-day whipsaw, at the cost of later recovery confirmation.
Comparison laboratory
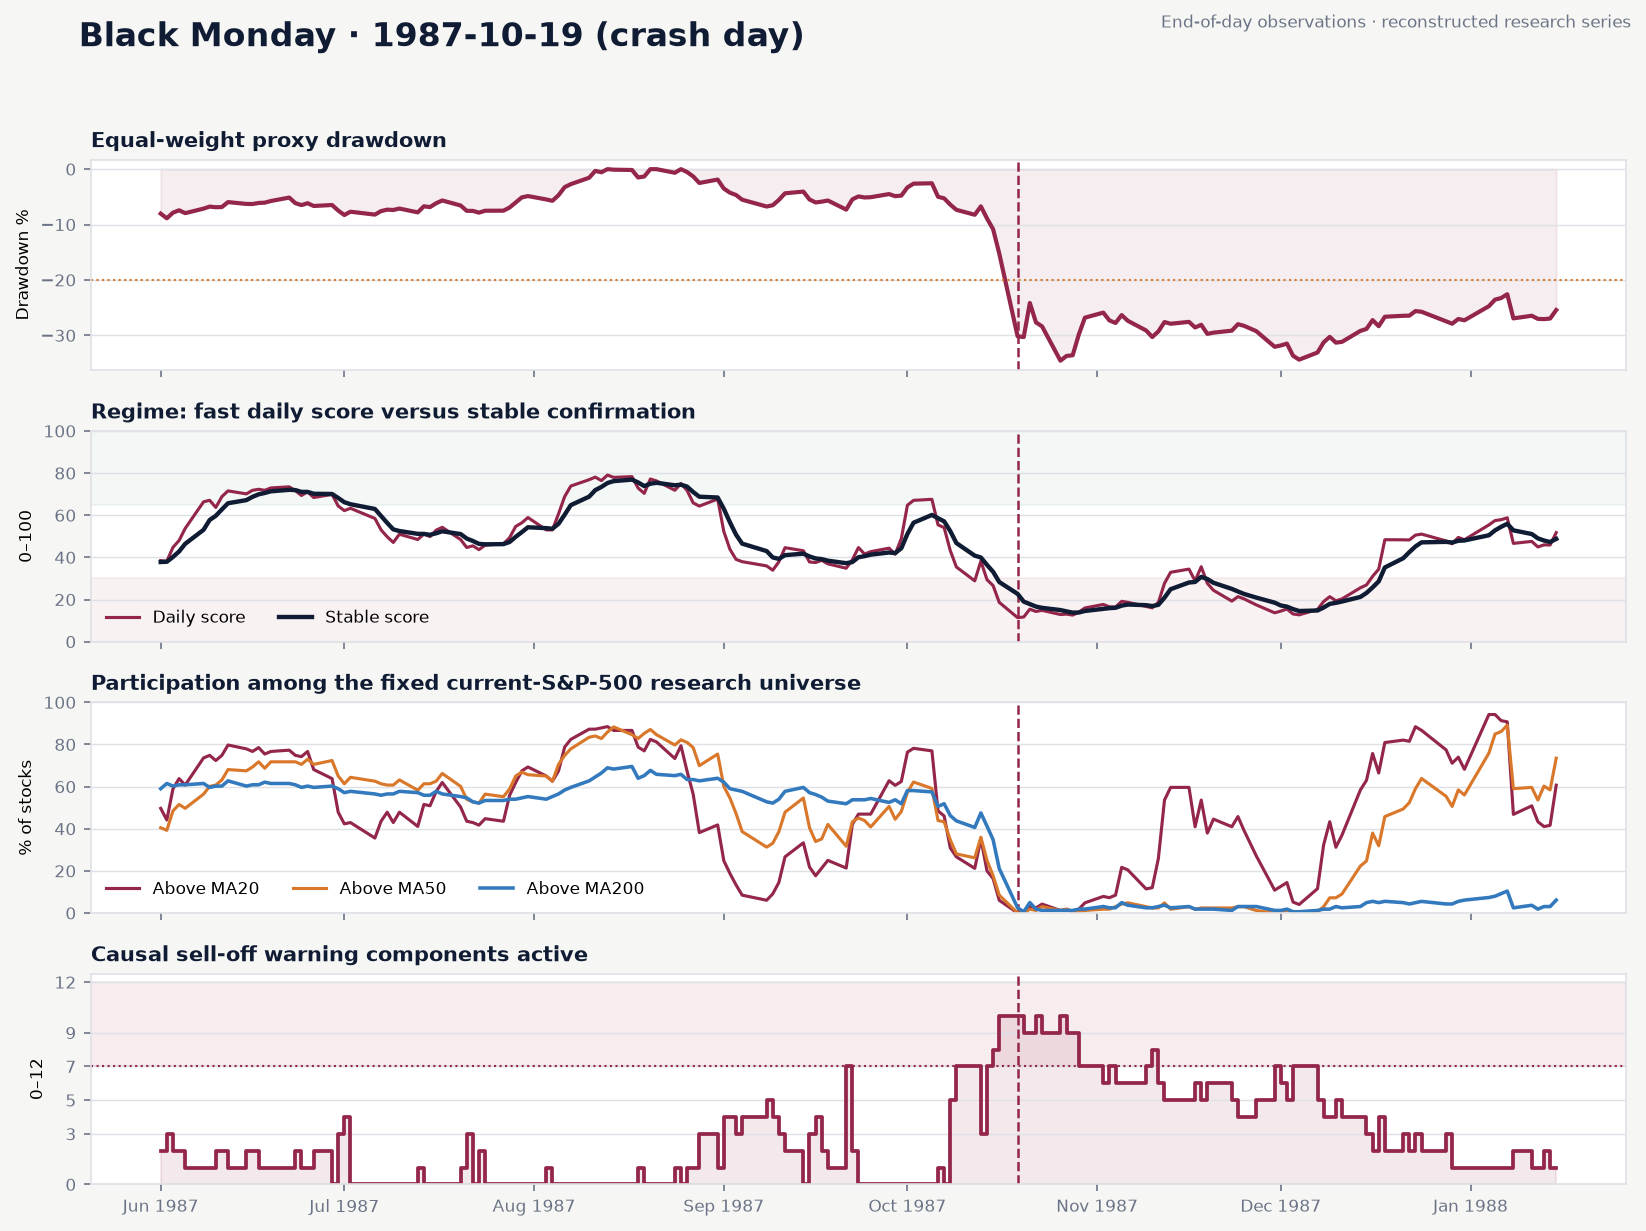
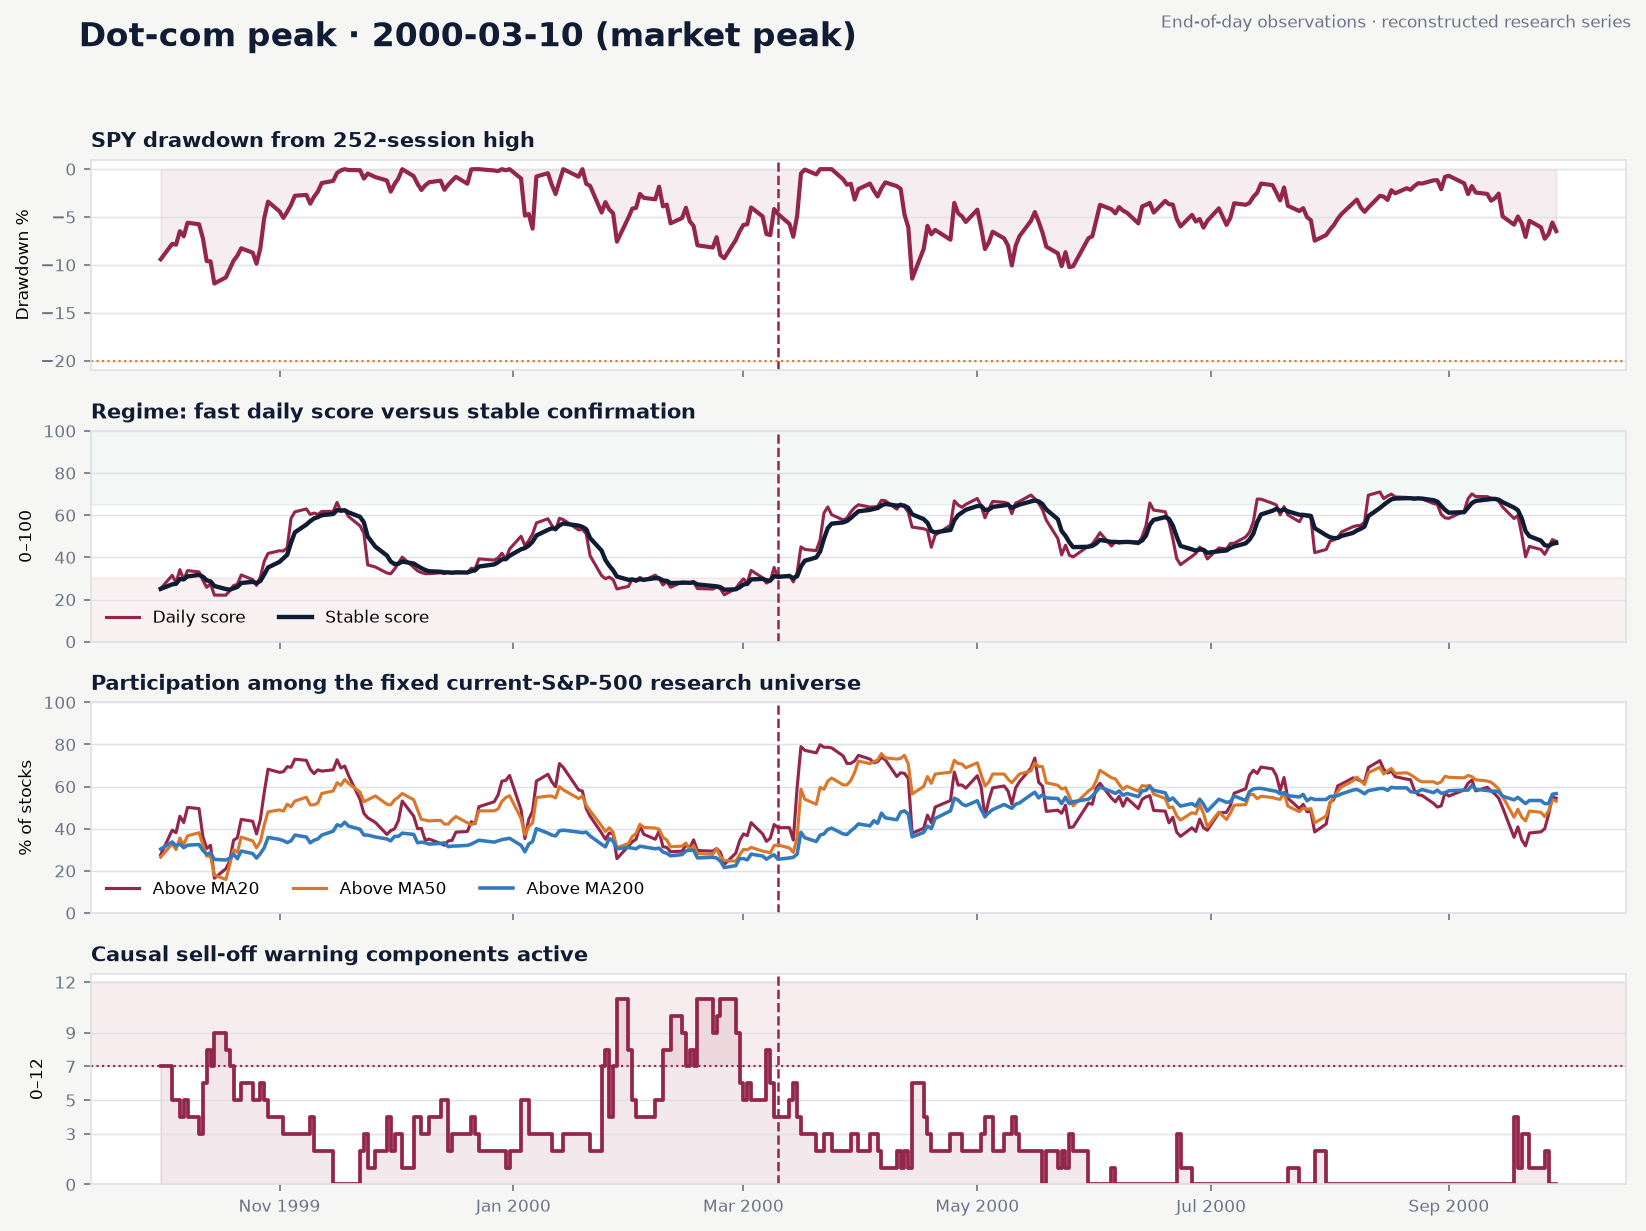
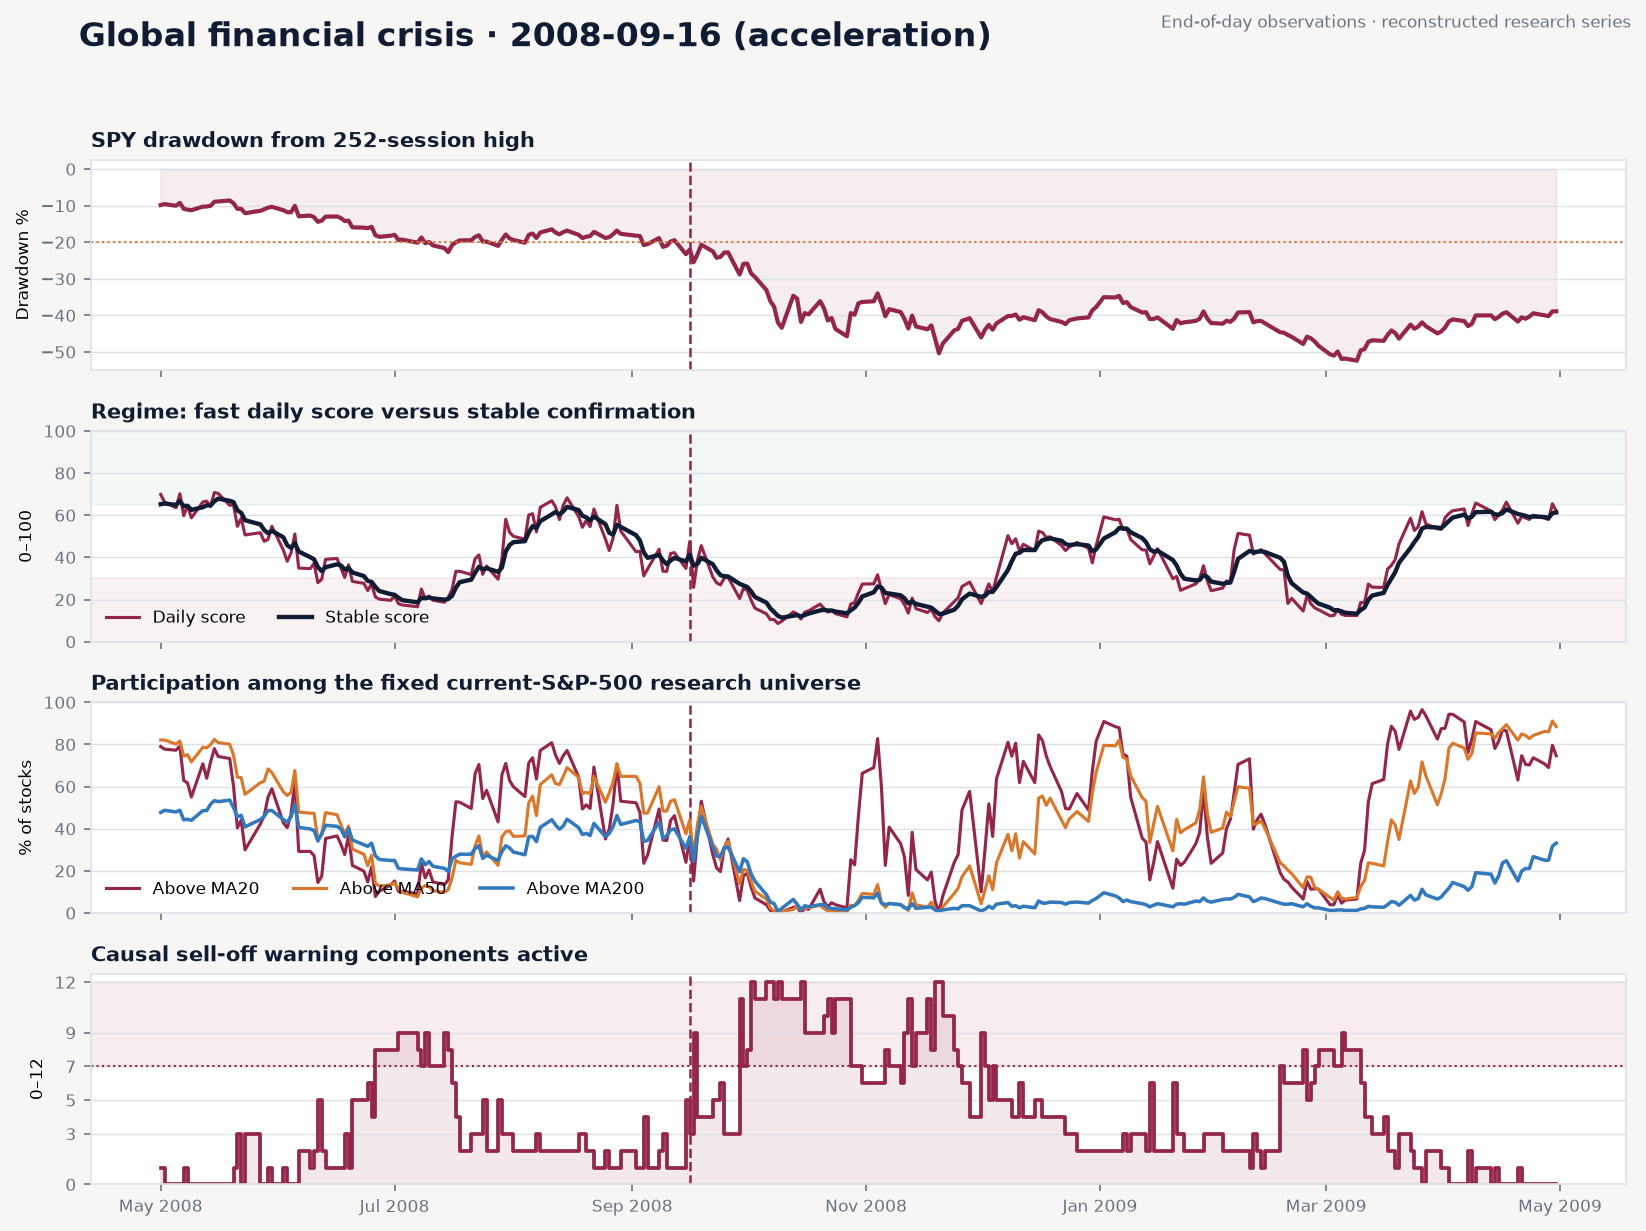
Select an event. Each chart uses the same four panels and scales, but event dates play different roles: peaks, onset dates, accelerations and crash days must not be interpreted as if they were identical.
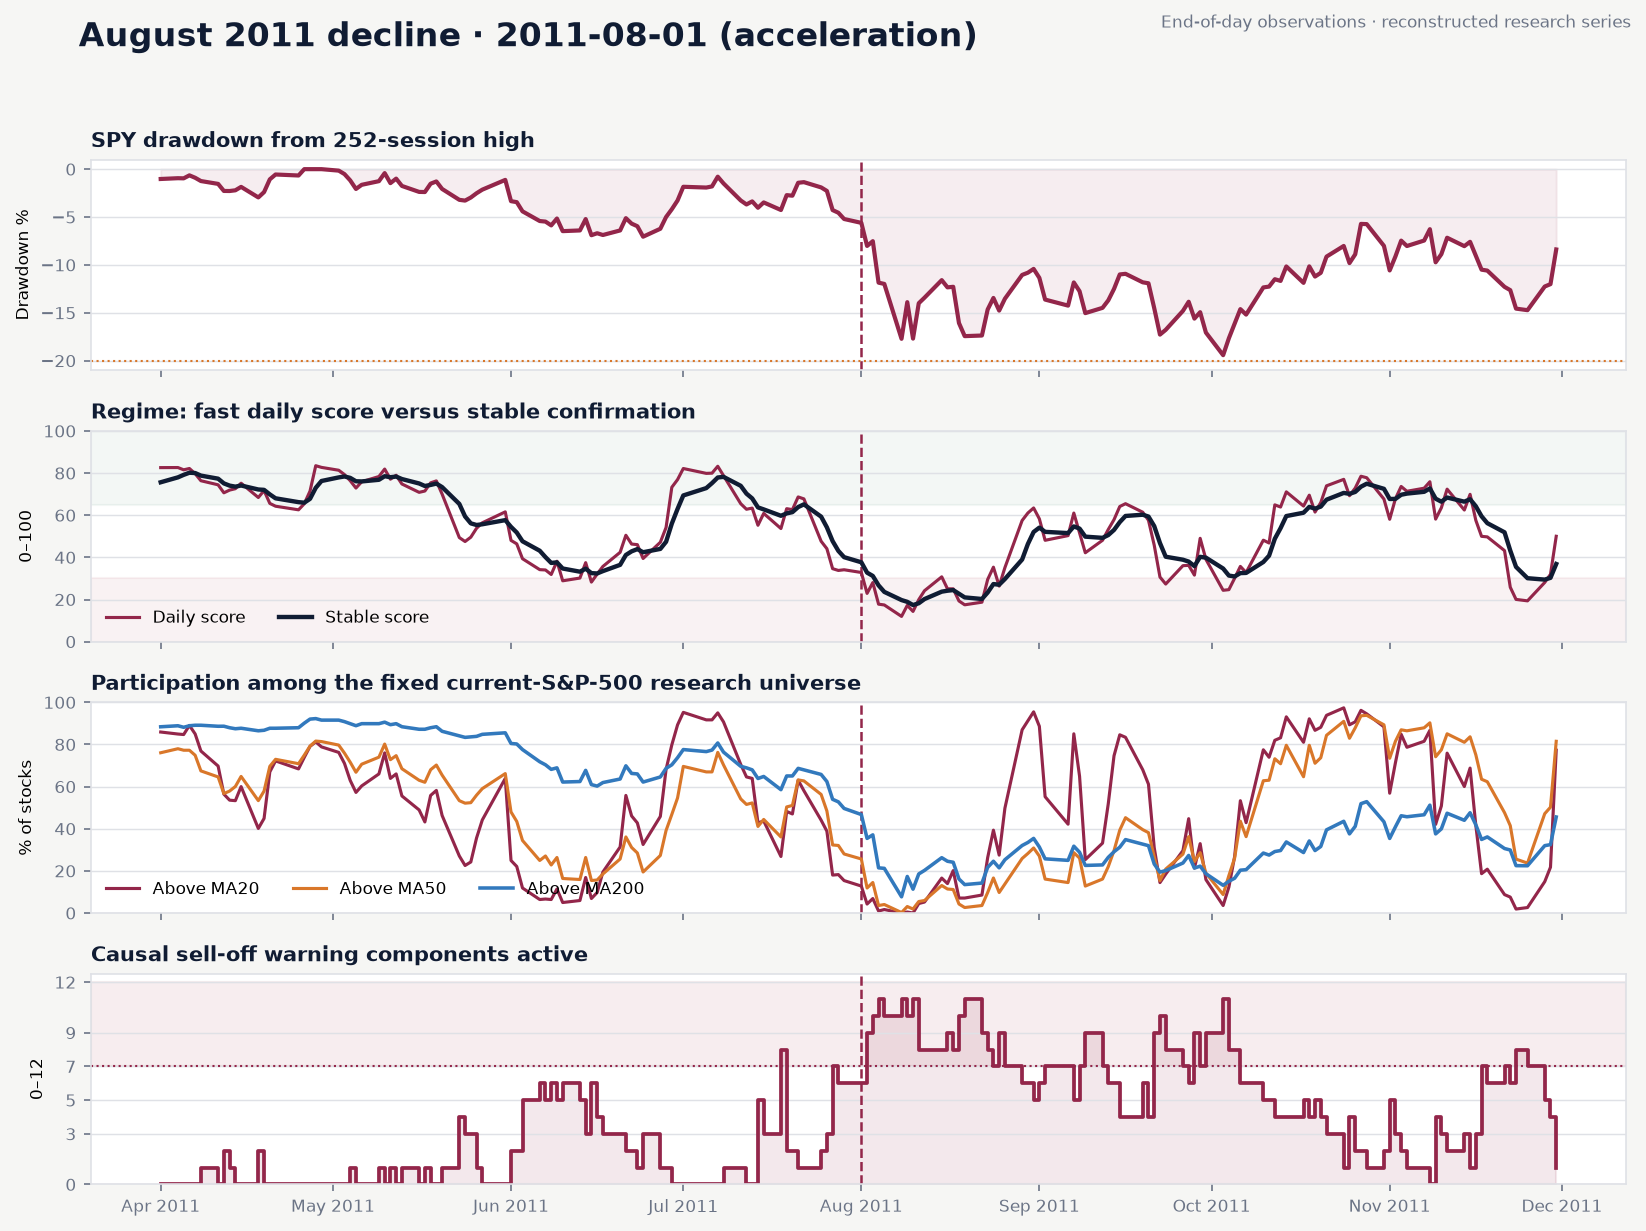
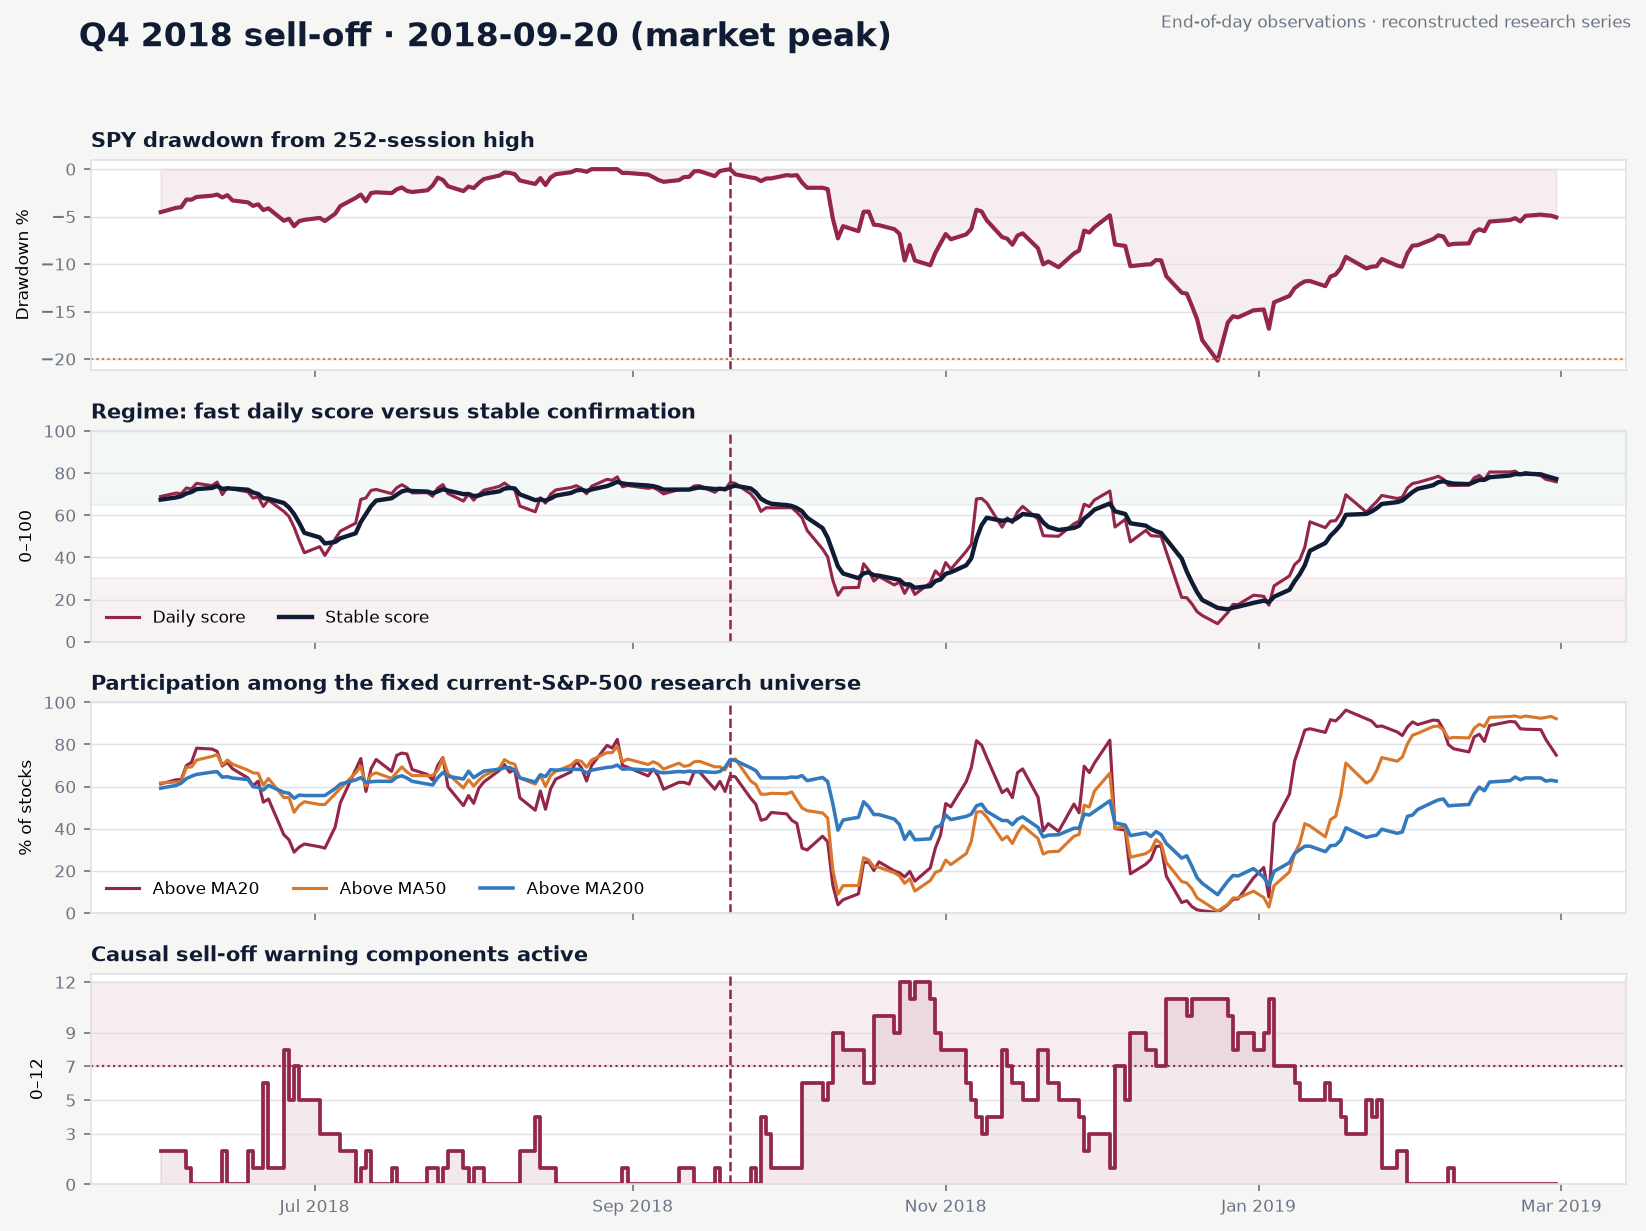
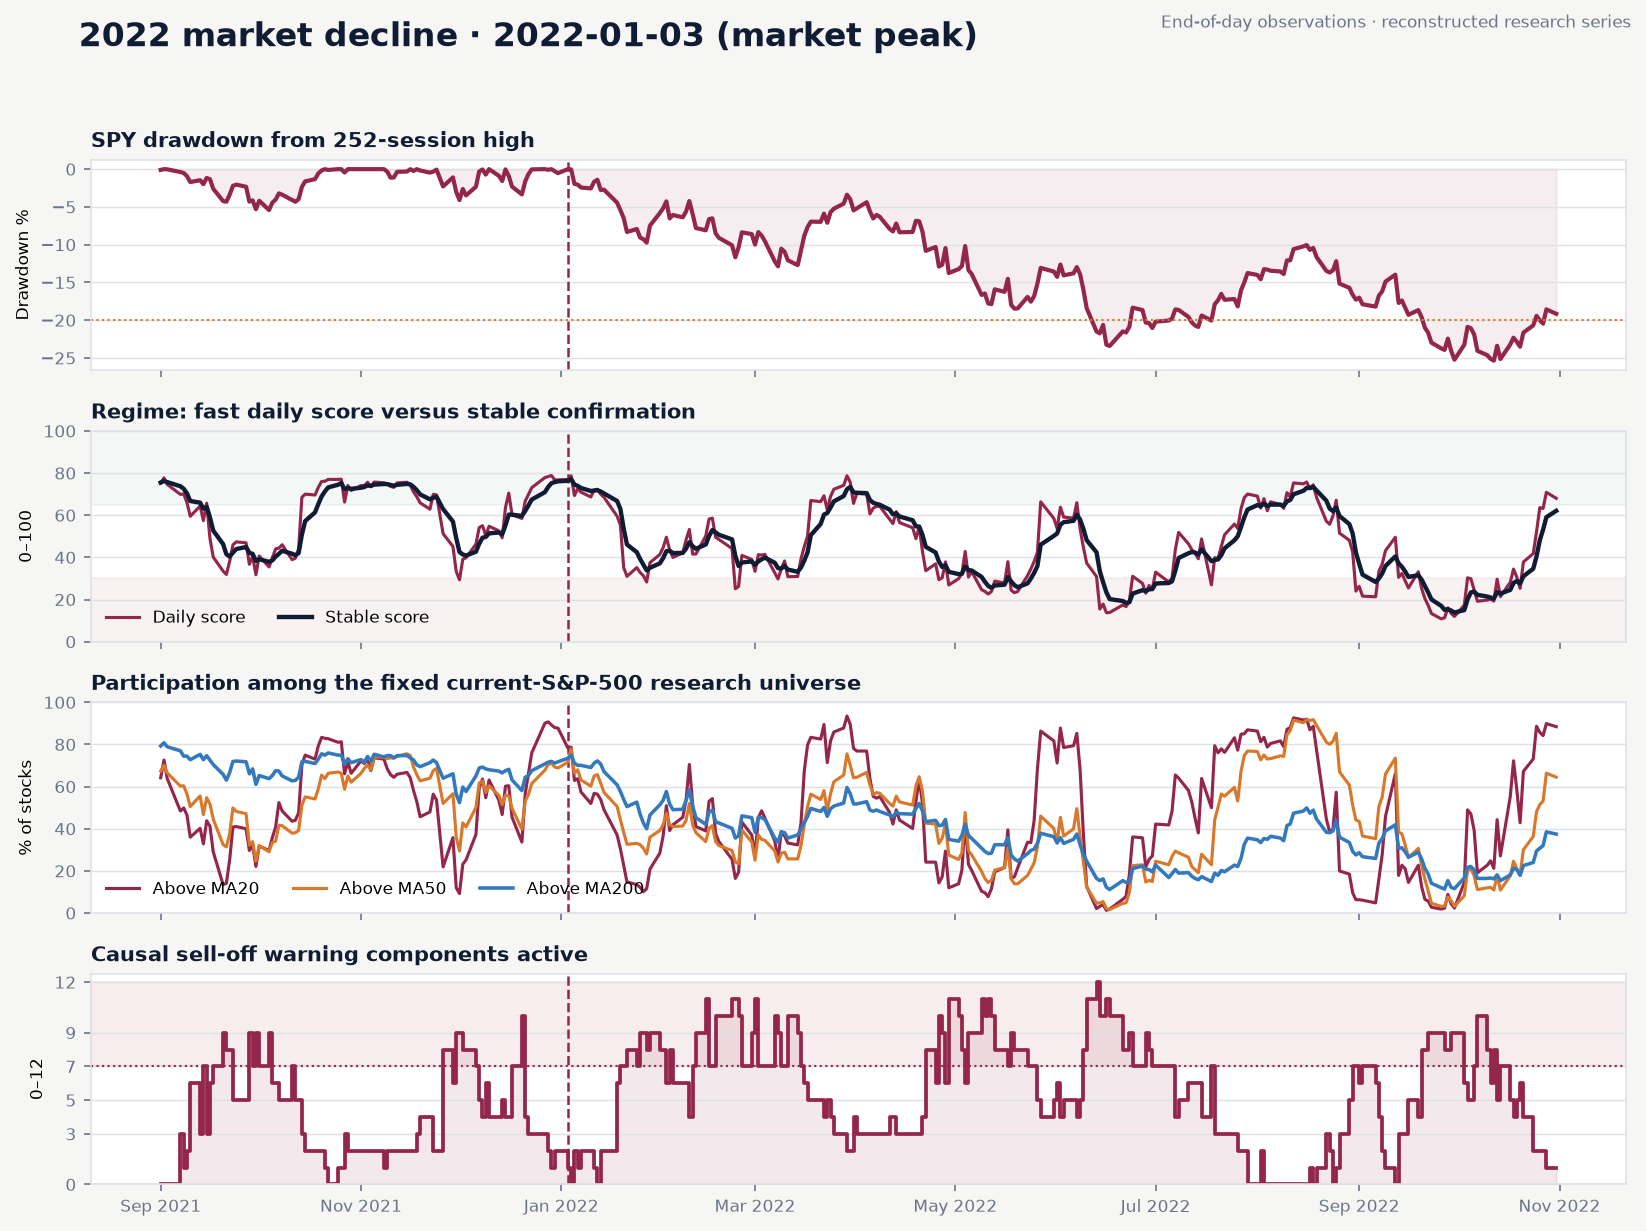
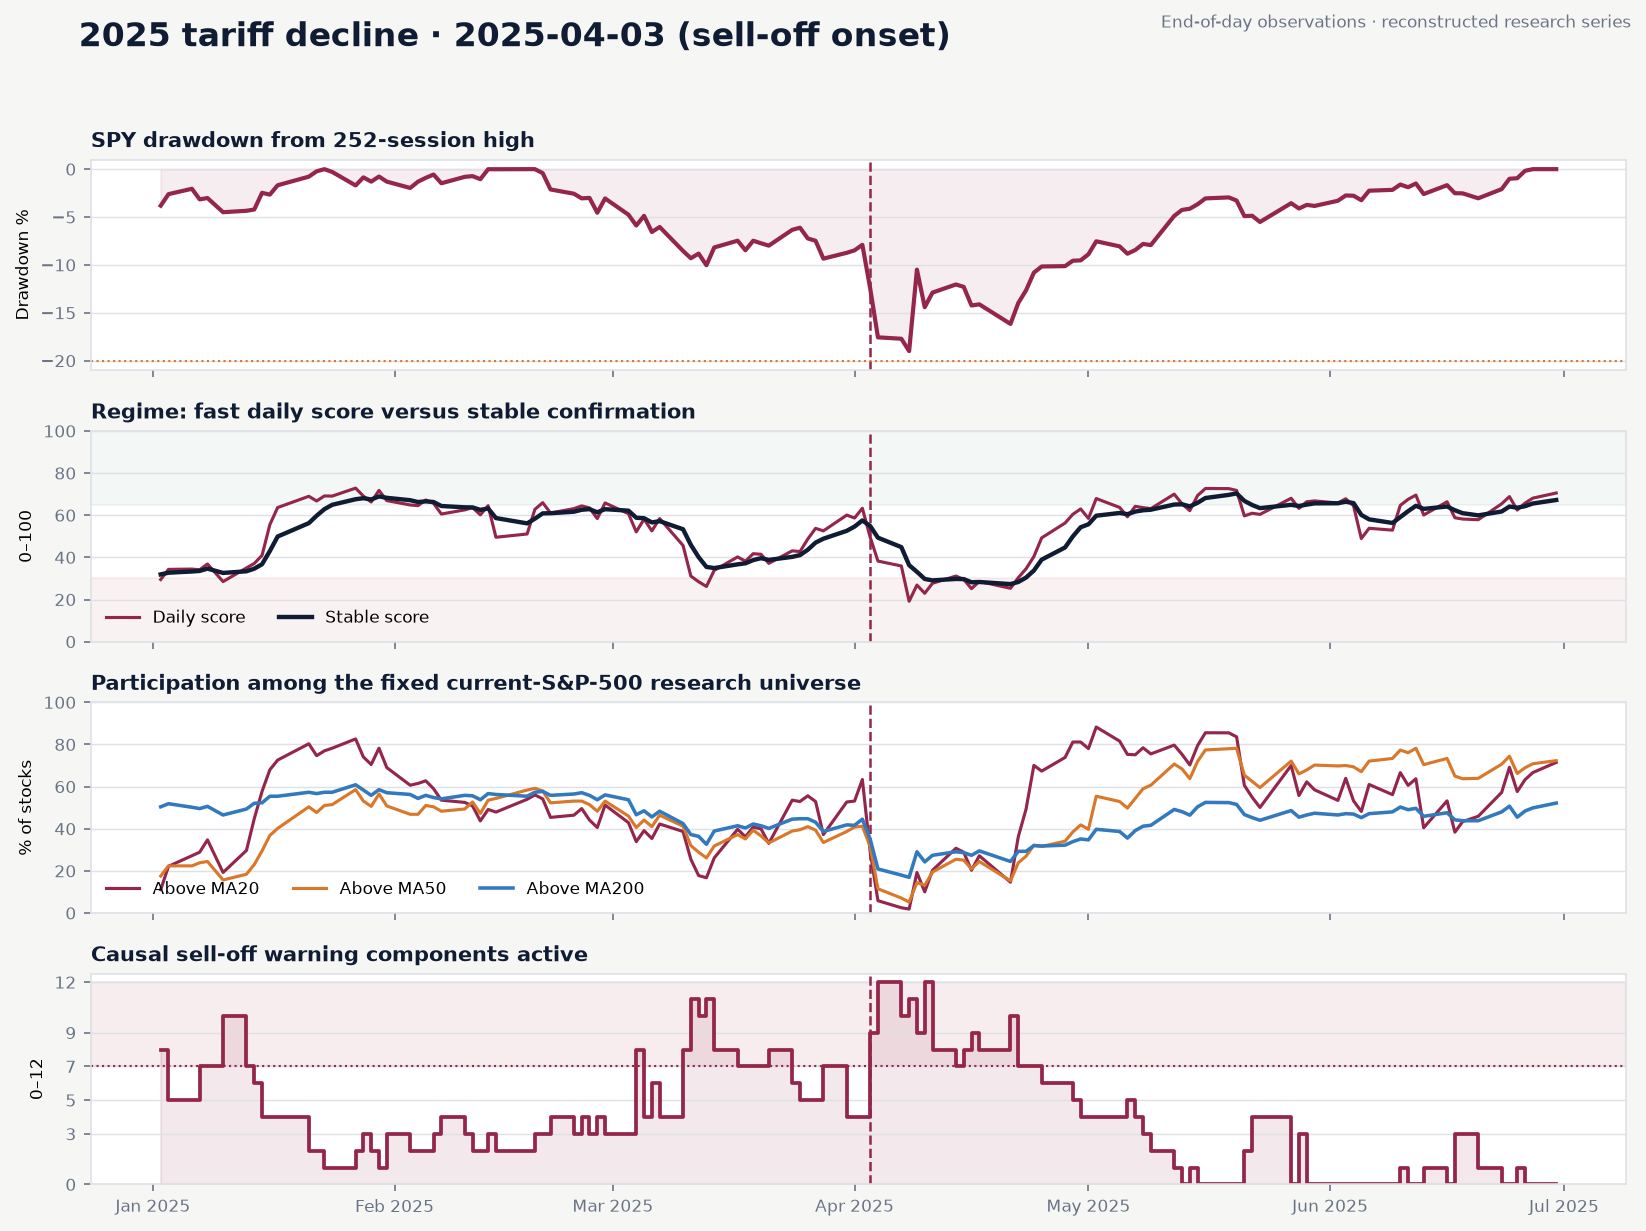
Lead-time snapshots
Counts show active causal warning components 21, 10, 5 and 1 trading days before each event marker. A low count before a shock is evidence of a limitation, not a result to hide.
| Event | Marker | Date role | Warning count · T−21 / T−10 / T−5 / T−1 |
|---|---|---|---|
| Black Monday | 1987-10-19 | crash day | 1 / 0 / 7 / 10 |
| Dot-com peak | 2000-03-10 | market peak | 8 / 11 / 5 / 4 |
| Global financial crisis | 2008-09-16 | acceleration | 2 / 1 / 3 / 5 |
| August 2011 decline | 2011-08-01 | acceleration | 0 / 8 / 2 / 6 |
| Q4 2018 sell-off | 2018-09-20 | market peak | 0 / 0 / 0 / 0 |
| COVID-19 crash | 2020-02-24 | sell-off onset | 0 / 1 / 0 / 2 |
| 2022 market decline | 2022-01-03 | market peak | 8 / 7 / 3 / 2 |
| 2025 tariff decline | 2025-04-03 | sell-off onset | 4 / 7 / 5 / 4 |
All-day validation
The strict ≥7-component state was evaluated on every eligible day from 2013 onward against an objective five-session crash definition. Lift is useful; low precision shows why this is a risk state rather than a crash-date forecast.