
DATA CUTOFF · WED, 30 SEP 2026 · DAILY CLOSE Fresh DAILY DATA · NOTHING HERE IS FINANCIAL ADVICE

A quantitative market notebook

Researching Markets,
One Experiment at a Time

Daily market intelligence, historical context, and systematic trading research.

Today’s Market Pulse

SPY · 11 US SECTOR ETFs

How to read these indicators →
Market regime · Observed
◆ Risk-Off Bear
Daily regime model
Regime score
23.1 / 100
▼ -3.8
S&P 500 constituents · % > MA50
19.5%
▼ -3.5pp
Sell-off risk · Observed
Very High
8 of 12 components
Leading sector ETF
▲ XLK
▲ +0.2% over 1 week
Expected SPY range · Forecast
760.5 – 766.2
50% band · Shadow · Low confidence
Data coverage
96.9% current
466 of 481 classified symbols

Daily-data models only. Analysis covers Swing (1–10 sessions) and Position (weeks–months) horizons; no intraday signals are published.

WED, 30 SEP 2026 VS PREVIOUS COMPLETED SESSION

What Changed Today?

  1. The regime score fell 3.8 points to 23.1, classified as Risk-Off Bear.
  2. MA50 breadth contracted 3.5 percentage points to 19.5%.
  3. Sell-off risk is very high with 8 of 12 monitored components active.
Abstract view of financial chartsLATEST DAILY

2026-09-30-market-intelligence

Participation deteriorated; the broader regime is risk-off bear.

Decliners outnumbered advancers 350 to 113. MA50 breadth contracted 3.5 percentage points to 19.5%. Sell-off risk is very high.

Swing · 1–10 sessionsPosition · weeks–monthsObserved daily data

Inside today’s market · Observed data

Current readings in historical context

Persisted daily observations through the latest completed session. Context, not financial advice.

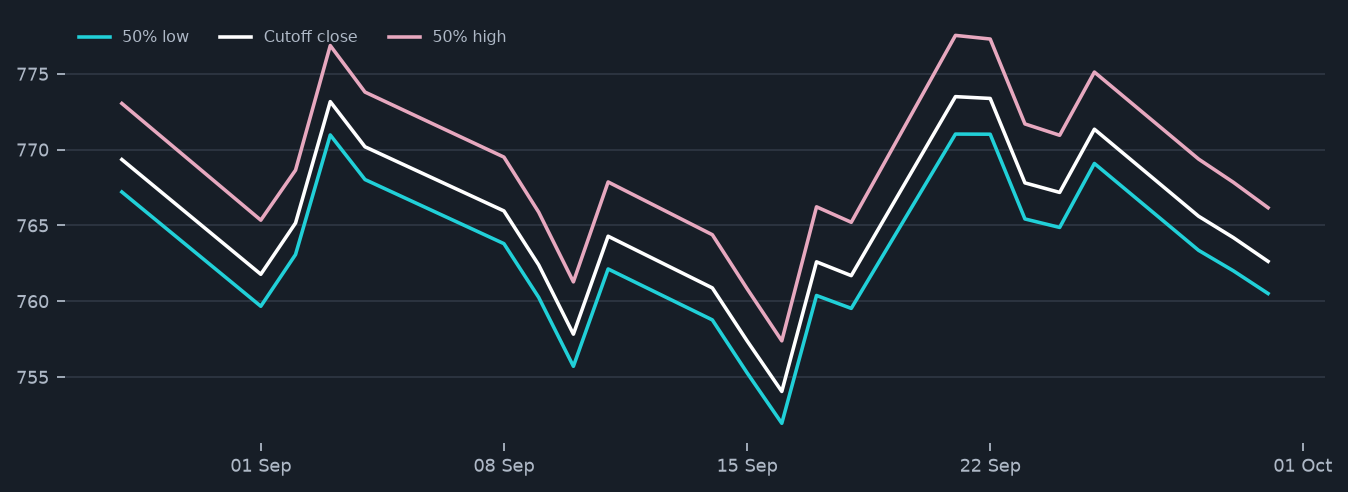
SPY range · forecast record

Published 50% bands versus cutoff close

760.5–766.2
Published SPY forecast range history

22 recorded sessions available since 28 Aug. Forecast history is shown in full; it is newer than the observed series.

How to interpret the range →

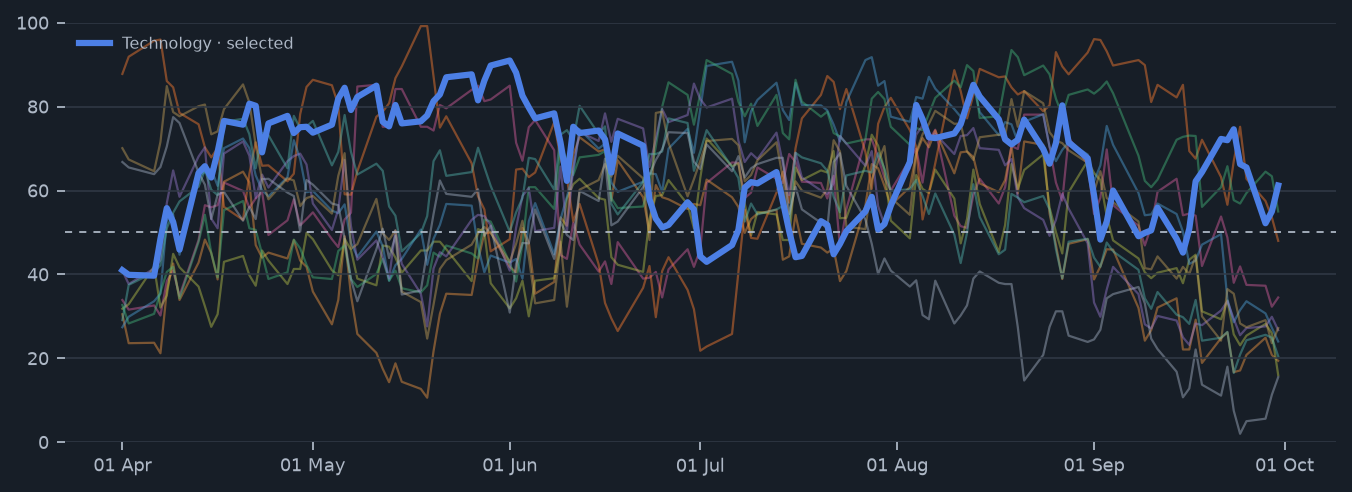
Sector momentum · historical

Composite score through time

Market internals · historical

Four independent views of breadth and participation

Sector composites · distance from neutral

Where participation and momentum are strongest

Neutral = 50
Technology61.2
Health Care55
Energy48
Communication Services34.5
Materials27.2
Industrials26.7
Financials24
Real Estate20.5
Consumer Discretionary19.4
Consumer Staples16
Utilities15.5

Being Built Next

The notebook will grow only when each dataset and method is ready to be audited.

01 · ResearchNext

Historical edges and indicator studies

Conditions, sample sizes, distributions and failure cases—not isolated headline results.

02 · StrategiesPlanned

Tracked systematic models

Every model separated into backtest, paper-shadow and out-of-sample results.

03 · VaultPlanned

Research notes and datasets

Versioned notebooks, definitions and source notes behind the published work.

04 · LearnPlanned

Methods without shortcuts

Plain-language guides to breadth, regimes, calibration and systematic testing.

About

About this notebook

HGTrading is a record of quantitative market research built from daily data.

The aim is to make each conclusion traceable: what was observed, what came from a historical test, what is only a forecast, and what remains unknown. Published values are preserved so the record can be evaluated honestly over time.